Usage Patterns For iPhone Versus iPad Users
If you’re planning to release an app for iOS devices, the latest findings from Flurry might shed some light and help you take a decision to start with the iPhone or the iPad. Flurry measures activity on 397 million active iOS devices, but their sample for this analysis was around 44,295 devices (iPhone and iPad) during May.
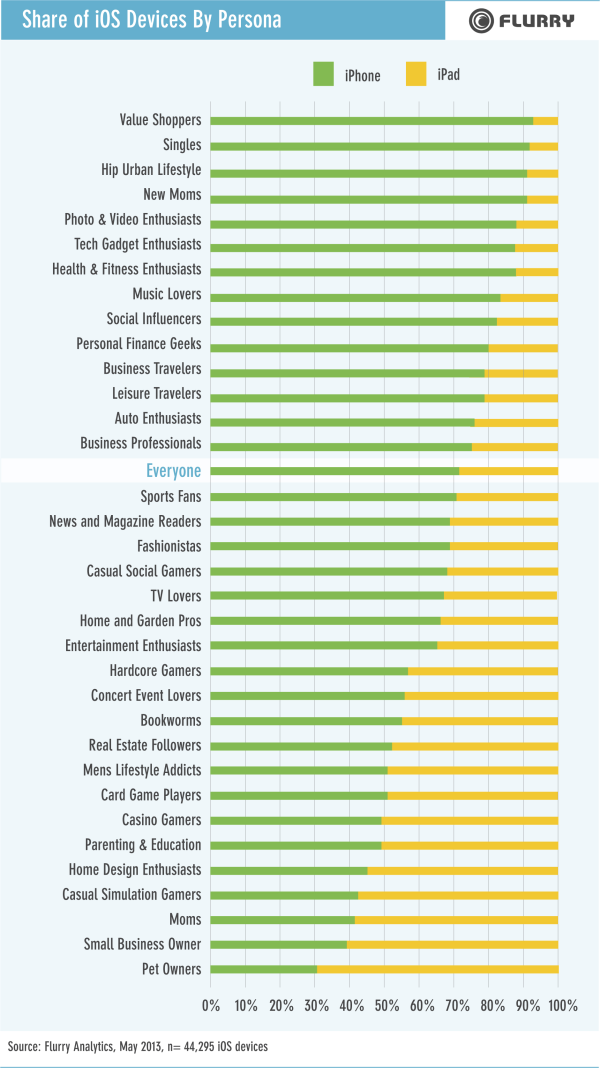
There were identified a set of personas who are using one device more than the other. Value shoppers (to scan barcodes and find bargains), new moms, singles (to socialize), photo and video enthusiasts, music lovers, business travelers are just some of the categories that tend to use the iPhone rather then the iPad. On iPad’s side there are: pet owners, small business owners, moms (to entertain and educate children), casual gamers, people passionate about parenting and education, card game players, real estate, home and garden pros.
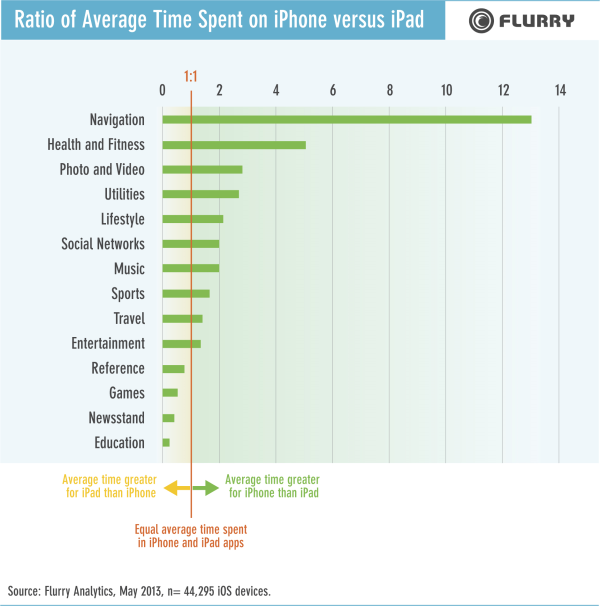
The research showed that iPad owners spent 42% more time in apps on their devices than iPhone owners during May. The category where the difference in usage between iPhone (13 times as much time ) and iPad is most visible is Navigation. iPhone users also spent more than five times as much time using Health and Fitness apps to do things such as tracking walks, runs, and bike rides. The app categories for which average time spent on iPad exceeds that for iPhone are Education, Newsstand, Games, and Reference. Again, more home-oriented activities.
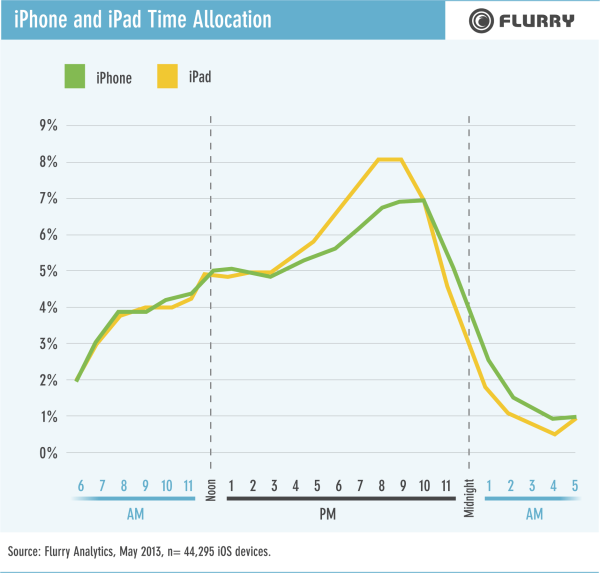
When it comes to time allocation, the iPhone and the iPad a running close to each other, with heaviest period of use for iPad is between 6 pm and 11 pm – times when most users are playing games and reading. The situation reverses as the night comes, and between 2 am and 4 am people tend to use the iPhone more. This may be insomniacs reaching for phones at their bedside or those Singles and Hip Urban Lifestylers finding their way home from a late night.


